Et rasjonalt uttrykk er en brøk der både teller og nevner er polynomer:
R(x) = \frac{P(X)}{Q(x)}- $R(x)$ er en rasjonal funksjon
- $P(x)$ og $Q(x)$ er polynomer
+ Eksempel
Eksempel på rasjonal funksjon:
R(x) = \frac{x^2 + 2}{x - 3}- Telleren ($x^2 + 2$) er et polynom av grad 2
- Nevneren ($x – 3$) er et polynom av grad 1
- Funksjonen er definert for alle tall bortsett fra når $x-3 = 0$, dvs. når $x=3$
+ Hvordan skisserer jeg grafen til en rasjonal funksjon?
Vil du skissere en rasjonal funksjon?
- Finn eventuelle horisontale asymptoter
- Finn eventuelle vertikale asymptoter og merk deg om grafen går mot pluss eller minus uendelig når du nærmer deg asymptoten ovenfra og nedenfra
Noen ganger kan du trenge mer. Da kan du:
- finne eventuelle nullpunkt
- sette $x=0$ for å se når grafen krysser $y$-aksen
- sjekke eventuelle symmetriegenskaper
+ Hvordan finner jeg nullpunkter til en rasjonal funksjon?
Nullpunkter til en rasjonal funksjon, er alle $x$-verdiene som gir at den rasjonale funksjonen er lik null.
R(x) = \frac{P(x)}{Q(x)} = 0 \quad \Rightarrow \quad P(x) = 0+ Hva er en horisontal asymptote?
En horisontal asymptote, $y = L$, er en linje funksjonen ikke krysser når $x$ går mot pluss eller minus uendelig.
\lim_{x \to \pm \infty} f(x) = LVil du finne en horisontal asymptote når $f(x)$ er en rasjonal funksjon?
- Del både teller og nevner på $x^n$ der $n$ er høyeste eksponent.
- Regn ut grensen
+ Hva er en vertikal asymptote?
En vertikal asymptote, $x = a$, er en vertikal linje funksjonen ikke krysser når $x$ går mot $a$.
\lim_{x \to \pm a} f(x) = \pm \inftyVil du finne en vertikal asymptote når $f(x)$ er rasjonal funksjon?
- Sett nevneren lik null og finn $x$
+ Eksempel 1: Asymptoter og skisse
Finn asymptoter og skisser grafen når:
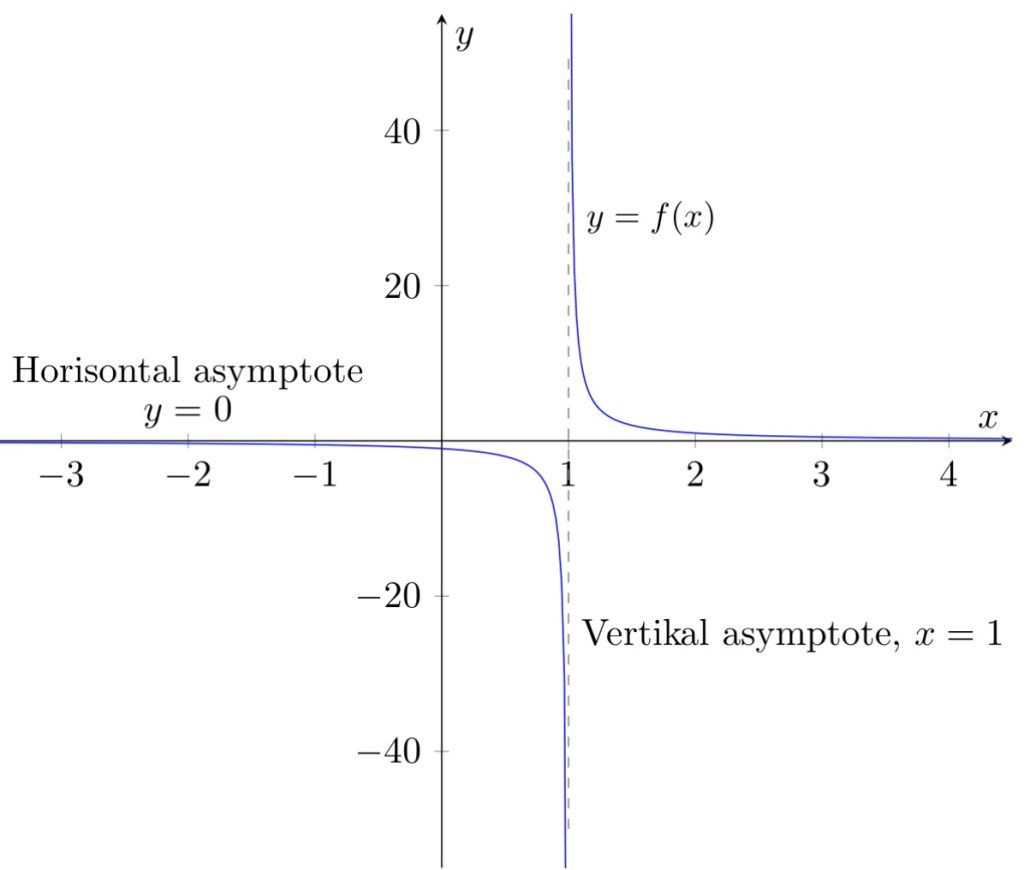
f(x) = \frac{1}{x-1}Horisontal asymptote:
Lar $x$ gå mot uendelig og deler både teller og nevner på $\textcolor{red}{x}$:
\lim_{x \to \pm \infty} f(x) = \lim_{x \to \pm \infty} \frac{1}{x-1} = \lim_{x \to \pm \infty} \frac{1 \cdot \textcolor{red}{\frac{1}{x}}}{(x-1) \cdot \textcolor{red}{\frac{1}{x}}} = \lim_{x \to \pm \infty} \frac{\frac{1}{x}}{1 - \frac{1}{x}} = \frac{0}{1} = 0siden $\textcolor{red}{\frac{1}{x} \to 0}$ når $x \to \pm \infty$. Derfor er $y = 0$ er en horisontal asymptote.
Vertikal asymptote:
Setter nevneren lik null:
x - 1 = 0 \quad \Rightarrow \quad x = 1
Dermed er $x = 1$ en vertikal asymptote.
For å skissere grafen, sjekker vi om funksjonen går mot pluss eller minus uendelig når $x$ går mot $1$ nedenfra ($\textcolor{red}{x \to 1^-}$) og ovenfra ($\textcolor{blue}{x \to 1^+}$):
\lim_{x \to \textcolor{red}{1^-}} f(x) = \lim_{x \to \textcolor{red}{1^-}} \frac{1}{x-1} = \textcolor{red}{-} \infty \quad \textnormal{ siden } x - 1 \textcolor{red}{<} 0 \textnormal{ når } x \to {\textcolor{red}{1^-}} \\
\lim_{x \to \textcolor{blue}{1^+}} f(x) = \lim_{x \to \textcolor{blue}{1^+}} \frac{1}{x-1} = \textcolor{blue}{+} \infty \quad \textnormal{ siden } x - 1 \textcolor{blue}{>} 0 \textnormal{ når } x \to {\textcolor{blue}{1^+}} \\
Legg merke til:
- Horisontal asymptote i $y = 0$
- Vertikal asymptote i $x=1$
- Når $x$ går mot 1 nedenfra ($x \to 1^-$), går $f(x)$ mot minus uendelig
- Når $x$ går mot 1 ovenfra ($x \to 1^+$), går $f(x)$ mot pluss uendelig
- Dersom du har asymptotene, kan du lage en enkel skisse av grafen
Og, vips, har vi funnet asymptotene og skissert grafen.
+ Eksempel 2: Asymptoter og skisse
Finn asymptoter og skisser grafen når:
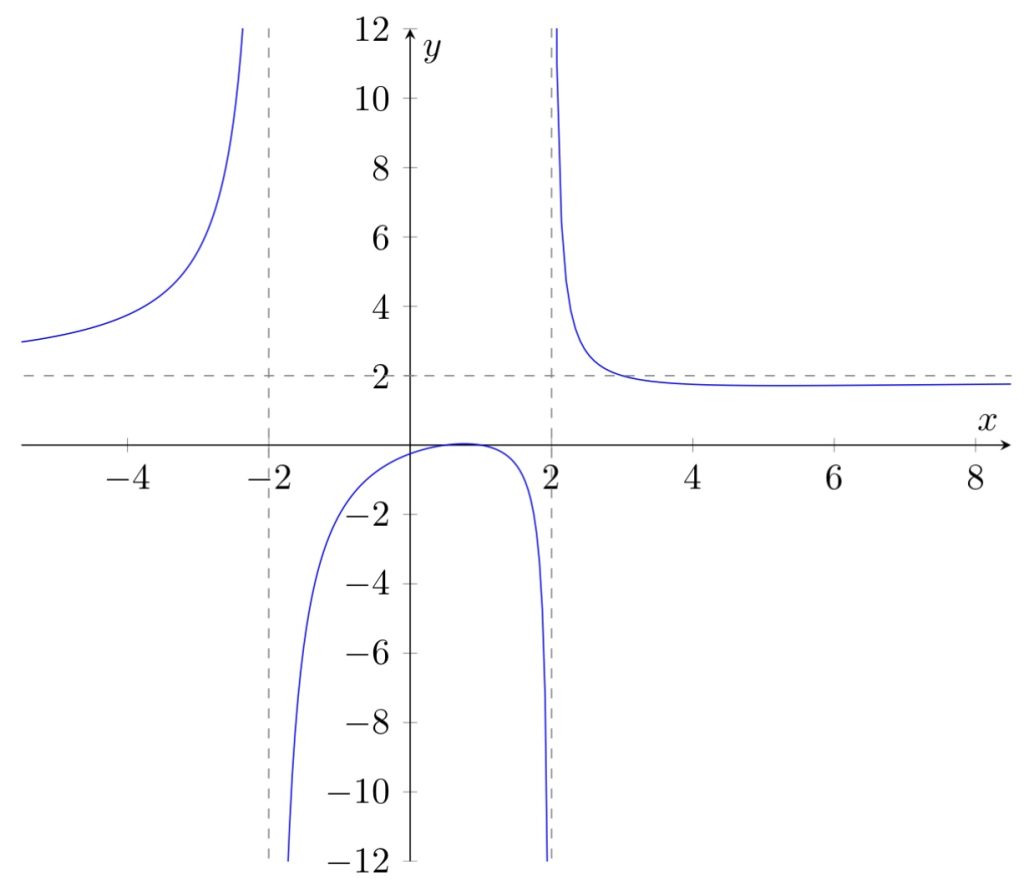
f(x) = \frac{2x^2 - 3x + 1}{x^2-4}Horisontal asymptote:
Lar $x$ gå mot uendelig og deler både teller og nevner på $\textcolor{red}{x^2}$:
\lim_{x \to \pm \infty} f(x) = \lim_{x \to \pm \infty} \frac{2x^2 - 3x + 1}{x^2-4} = \lim_{x \to \pm \infty} \frac{(2x^2 - 3x + 1) \cdot \textcolor{red}{\frac{1}{x^2}}}{(x^2-4) \cdot \textcolor{red}{\frac{1}{x^2}}} = \lim_{x \to \pm \infty} \frac{2 - \frac{3}{x} + \frac{1}{x^2}}{1 - \frac{4}{x^2}} = \frac{2}{1} = 2siden $\textcolor{red}{\frac{1}{x} \to 0}$ når $x \to \pm \infty$. Derfor er $y = 2$ er en horisontal asymptote.
Vertikal asymptote:
Setter nevneren lik null:
x^2 - 4 = 0 \quad \Rightarrow \quad x^2 = 4 \quad \Rightarrow \quad x = \pm 2
Dermed er $x = -2$ og $x = 2$ vertikale asymptoter.
For å skissere grafen, sjekker vi om funksjonen går mot pluss eller minus uendelig når $x$ går mot $\pm 2$ nedenfra ($\textcolor{red}{x \to \pm 2^-}$) og ovenfra ($\textcolor{blue}{x \to \pm 2^+}$):
\lim_{x \to \textcolor{red}{-2^-}} f(x) = \lim_{x \to \textcolor{red}{-2^-}}  \frac{2x^2 - 3x + 1}{x^2-4} = \textcolor{red}{+} \infty \quad \textnormal{ siden } x^2 - 4 \textcolor{red}{>} 0 \textnormal{ når } x \to {\textcolor{red}{-2^-}} \\
\lim_{x \to \textcolor{blue}{-2^+}} f(x) = \lim_{x \to \textcolor{blue}{-2^+}}  \frac{2x^2 - 3x + 1}{x^2-4} = \textcolor{blue}{-} \infty \quad \textnormal{ siden } x^2 - 4 \textcolor{blue}{<} 0 \textnormal{ når } x \to {\textcolor{blue}{-2^+}} \\
\lim_{x \to \textcolor{red}{2^-}} f(x) = \lim_{x \to \textcolor{red}{2^-}}  \frac{2x^2 - 3x + 1}{x^2-4} = \textcolor{red}{-} \infty \quad \textnormal{ siden } x^2 - 4 \textcolor{red}{<} 0 \textnormal{ når } x \to {\textcolor{red}{2^-}} \\
\lim_{x \to \textcolor{blue}{2^+}} f(x) = \lim_{x \to \textcolor{blue}{2^+}}  \frac{2x^2 - 3x + 1}{x^2-4} = \textcolor{blue}{+} \infty \quad \textnormal{ siden } x^2 - 4 \textcolor{blue}{>} 0 \textnormal{ når } x \to {\textcolor{blue}{2^+}} \\
Finner nullpunkt (for å lettere skissere grafen):
Setter telleren lik null og bruker andregradsformelen:
\begin{aligned}
& \textcolor{red}{2}x^2 \textcolor{blue}{- 3}x \textcolor{green}{+ 1} = 0 \\
\Rightarrow \quad & x = \frac{- (\textcolor{blue}{-3}) \pm \sqrt{(\textcolor{blue}{-3})^2 - 4 \cdot \textcolor{red}{2} \cdot \textcolor{green}{1})}}{2 \cdot \textcolor{red}{2}} \\
\Rightarrow \quad & x = \frac{3 \pm 1}{4} \\
\Rightarrow \quad & x = \frac{1}{2} \textnormal{ eller } x = 1
\end{aligned}
Funksjonen har to nullpunkt: $x = 0.5$ og $x = 1$.

Legg merke til:
- Horisontal asymptote i $y = 2$
- Vertikal asymptote i $x = -2$
- Når $x$ går mot -2 nedenfra ($x \to -2^-$), går $f(x)$ mot pluss uendelig
- Når $x$ går mot -2 ovenfra ($x \to -2^+$), går $f(x)$ mot minus uendelig
- Vertikal asymptote i $x = 2$
- Når $x$ går mot 2 nedenfra ($x \to 2^-$), går $f(x)$ mot minusuendelig
- Når $x$ går mot 2 ovenfra ($x \to 2^+$), går $f(x)$ mot pluss uendelig
- To nullpunkt: $x=0.5$ og $x=1$.
Og, vips, har vi funnet asymptotene og skissert grafen.
+ Eksempel 3: Asymptoter og skisse
Finn asymptoter og skisser grafen når:
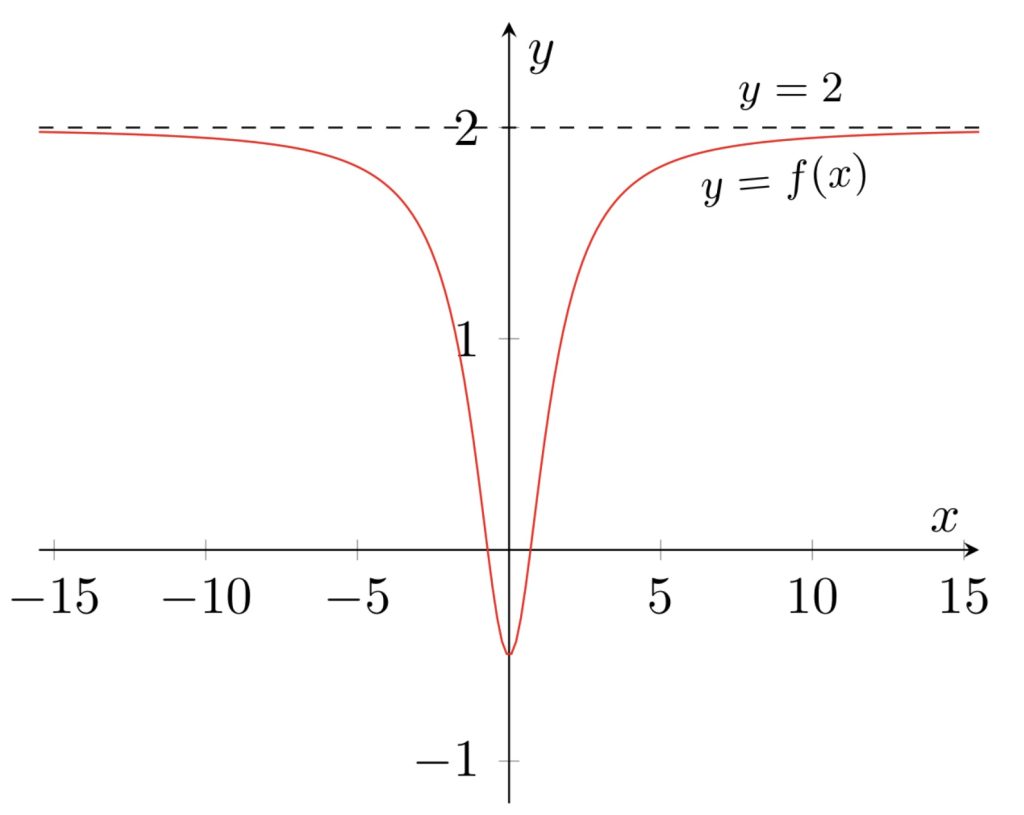
f(x) = \frac{2x^2 - 1}{x^2 + 2}Horisontal asymptote:
Lar $x$ gå mot uendelig og deler både teller og nevner på $\textcolor{red}{x^2}$:
\lim_{x \to \pm \infty} f(x)
= \lim_{x \to \pm \infty} \frac{2x^2 - 1}{x^2 + 2}
= \lim_{x \to \pm \infty} \frac{(2x^2 - 1) \cdot \textcolor{red}{\frac{1}{x^2}}}{(x^2 + 2) \cdot \textcolor{red}{\frac{1}{x^2}}}
= \lim_{x \to \pm \infty} \frac{2 - \frac{1}{x^2}}{1 + \frac{2}{x^2}} = \frac{2}{1} = 2
siden $\textcolor{red}{\frac{1}{x} \to 0}$ når $x \to \pm \infty$. Derfor er $y = 2$ er en horisontal asymptote.
Vertikal asymptote:
Funksjonen har ingen vertikale asymptoter siden neveren ikke kan bli null.
x^2 + 2 > 0
Sjekker symmetri (for å lettere skissere grafen):
f(-x) = \frac{2(-x)^2 - 1}{(-x)^2 + 2} = \frac{2x^2 - 1}{x^2 + 2} = f(x) $f(x)$ er symmetrisk om $y$-aksen (like funksjon).
Finner $f(0)$ (for å lettere skissere grafen):
f(0) = \frac{0^2 - 1}{0^2 + 2} = - \frac{1}{2}Dermed vet vi at grafen krysser $y$-aksen i $y = -\frac{1}{2}$.

Legg merke til:
- Horisontal asymptote i $y = 2$
- Ingen vertikale asymptoter
- Symmetrisk om $y$-aksen (like funksjon)
- Grafen krysser y-aksen i $y = -\frac{1}{2}$
Og, vips, har vi funnet asymptotene og skissert grafen.
+ Eksempel 4: Asymptoter og skisse
Finn asymptoter og skisser grafen når:
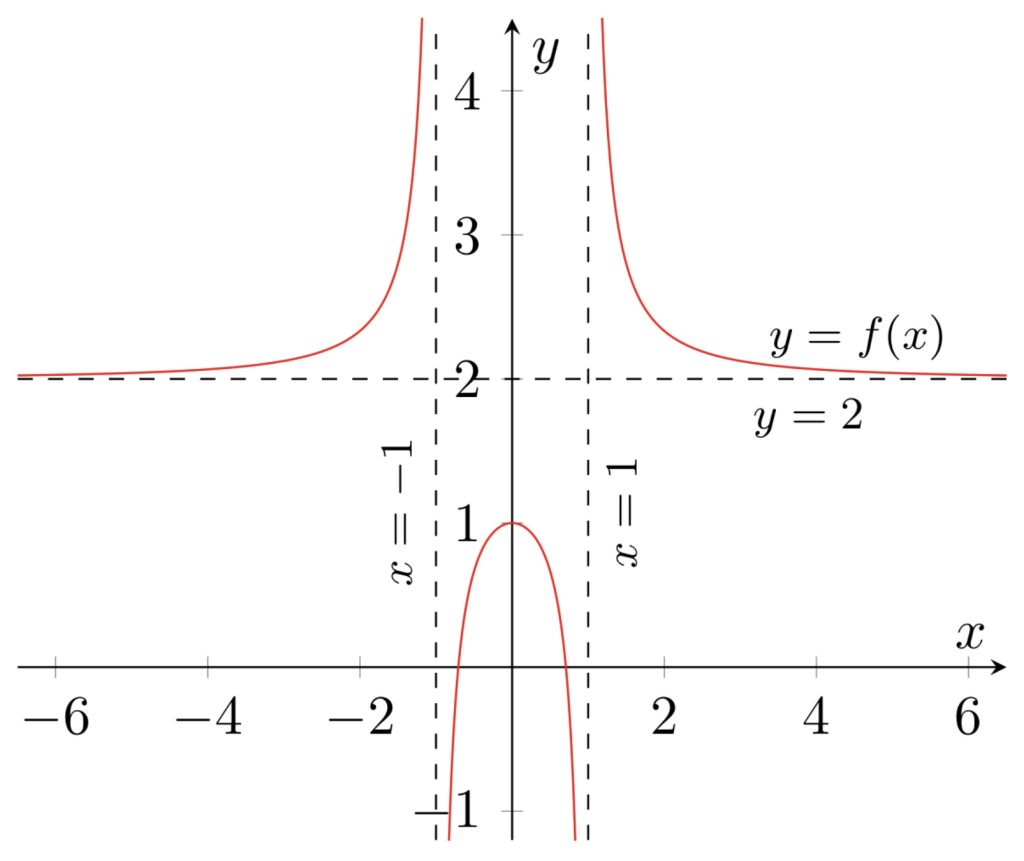
f(x) = \frac{2x^2 - 1}{x^2 - 1}Horisontal asymptote:
Lar $x$ gå mot uendelig og deler både teller og nevner på $\textcolor{red}{x^2}$:
\lim_{x \to \pm \infty} f(x)
= \lim_{x \to \pm \infty} \frac{2x^2 - 1}{x^2 - 1}
= \lim_{x \to \pm \infty} \frac{(2x^2 - 1) \cdot \textcolor{red}{\frac{1}{x^2}}}{(x^2 - 1) \cdot \textcolor{red}{\frac{1}{x^2}}}
= \lim_{x \to \pm \infty} \frac{2 - \frac{1}{x^2}}{1 - \frac{1}{x^2}} = \frac{2}{1} = 2
siden $\textcolor{red}{\frac{1}{x} \to 0}$ når $x \to \pm \infty$. Derfor er $y = 2$ er en horisontal asymptote.
Vertikal asymptote:
Setter nevneren lik null:
x^2 - 1 = 0 \quad \Rightarrow \quad x^2 = 1 \quad \Rightarrow \quad x = \pm 1
Dermed er $x = -1$ og $x = 1$ vertikale asymptoter.
For å skissere grafen, sjekker vi om funksjonen går mot pluss eller minus uendelig når $x$ går mot $\pm 1$ nedenfra ($\textcolor{red}{x \to \pm 1^-}$) og ovenfra ($\textcolor{blue}{x \to \pm 1^+}$):
\lim_{x \to \textcolor{red}{-1^-}} f(x) = \lim_{x \to \textcolor{red}{-1^-}}  \frac{2x^2 - 1}{x^2-1} = \textcolor{red}{+} \infty \quad \textnormal{ siden } x^2 - 1 \textcolor{red}{>} 0 \textnormal{ når } x \to {\textcolor{red}{-1^-}} \\
\lim_{x \to \textcolor{blue}{-1^+}} f(x) = \lim_{x \to \textcolor{blue}{-1^+}}  \frac{2x^2 - 1}{x^2-1} = \textcolor{blue}{-} \infty \quad \textnormal{ siden } x^2 - 1 \textcolor{blue}{<} 0 \textnormal{ når } x \to {\textcolor{blue}{-1^+}} \\
\lim_{x \to \textcolor{red}{1^-}} f(x) = \lim_{x \to \textcolor{red}{1^-}}  \frac{2x^2 - 1}{x^2-1} = \textcolor{red}{-} \infty \quad \textnormal{ siden } x^2 - 1 \textcolor{red}{<} 0 \textnormal{ når } x \to {\textcolor{red}{1^-}} \\
\lim_{x \to \textcolor{blue}{1^+}} f(x) = \lim_{x \to \textcolor{blue}{1^+}}  \frac{2x^2 - 1}{x^2-1} = \textcolor{blue}{+} \infty \quad \textnormal{ siden } x^2 - 1 \textcolor{blue}{>} 0 \textnormal{ når } x \to {\textcolor{blue}{1^+}} \\
Finner $f(0)$ (for å lettere skissere grafen):
f(0) = \frac{2 \cdot 0^2 - 1}{0^2 - 1} = \frac{-1}{-1} = 1Dermed vet vi at grafen krysser $y$-aksen i $y = 1$.

Legg merke til:
- Horisontal asymptote i $y = 2$
- Vertikal asymptote i $x = -1$
- Når $x$ går mot -1 nedenfra ($x \to -1^-$), går $f(x)$ mot pluss uendelig
- Når $x$ går mot -1 ovenfra ($x \to -1^+$), går $f(x)$ mot minus uendelig
- Vertikal asymptote i $x = 1$
- Når $x$ går mot 1 nedenfra ($x \to 1^-$), går $f(x)$ mot minus uendelig
- Når $x$ går mot 1 ovenfra ($x \to 1^+$), går $f(x)$ mot pluss uendelig
- Grafen krysser $y$-aksen i $y = 1$
Og, vips, har vi funnet asymptotene og skissert grafen.
